City of Pittsburgh Branding
Graphic Design, Fall 2019
Working with the Mayor’s Office of the City of Pittsburgh I helped update the city’s brand identity. The direction expressed by the Mayor was a return to some of the historical roots of Pittsburgh’s image. The most prominent example of this direction is a deep blue found in early illustrations of the City Crest added to the more broadly known black and gold.
In the absence of city wide guidelines the many different departments, offices, boards, and other city entities had developed independent looks over the years. This brand does not completely remove the individualized seals, but organizes them more intentionally by operating group in addition to standardizing details such as colors and fonts.
The first use of the new branding was the Mayor’s 2020 budget presentation. Each section of the budget starts with that department’s new seal. For the covers I used stills from a timelapse I captured last year (one predawn and the other post sunrise). Combined with the new blue and gold colors the capital and operating budgets are clearly a set but can be quickly distinguished when referencing.
Pittsburgh Paving Program
Process Improvement, Summer 2019
Communication and coordination between the many groups that are involved in or depend on the yearly Paving Program schedule needed to be reworked to improve efficiency and avoid conflicts. To accomplish this I focused on both our internal schedule planning as well as our external schedule outreach.
Internal Schedule Planning
To improve internal communication the spreadsheet used to track what streets will be paved needed to be updated and made accessible.
The existing document was hobbled by a lack of tables, preventing any kind of sorting or filtering. As a result information was organized manually, rigidly siloed in seperate sheets. This created a lot of redundancy and opportunities for mistakes to go unnoticed.
In order for this to be a live document updated frequently by multiple contributors it needed to be made more resilient. I consolidated the lists of streets into a single table, added new columns for tracking information such as funding source and material, and created new analysis formulas to take advantage of the new more detailed information.
Weekly Scheduling and Daily Work Tracking
A spreadsheet including work completed, active work, as well as a one week look ahead was created and maintained by our paving contractor. Unfortunately this document lacked contextual information, was not designed for filtering, sorting, or readability, and had no process for recording schedule changes when they occured.
With some attention to the design and usability this document and its valuable schedule information can be shared more broadly with coordinating organizations, stakeholders, and impacted residents. Automated color coding, council district and neighborhood information, as well as a notes column for explaining why a schedule change has occurred combine to make this a useful communications tool.
Paving Outreach Performance
The existing paving schedule outreach focused on communicating a weekly look ahead schedule to impacted residents as well as our partners such as utility companies also scheduling work in the Right-of-Way. In order to test the effectiveness of this format I tracked schedule changes made to the contractor’s work tracking spreadsheet over the course of a few months.
I found that the weekly format is ineffective considering the frequent schedule changes due to logistics and/or inclement weather. Often as many as 80% of the streets in a weekly schedule included dates that were incorrect by the end of that week.
Civic Leadership Academy
Communication and Design, Fall 2019
The Civic Leadership Academy is an incredible program offered by the City for civically engaged residents to attend a series of presentations hosted by a large variety of City departments and organizations. To educate the attendees about the Department of Mobility and Infrastructure I worked with a group of coworkers from across our Bureaus and Divisions to present on our many projects, operations, and responsibilities.
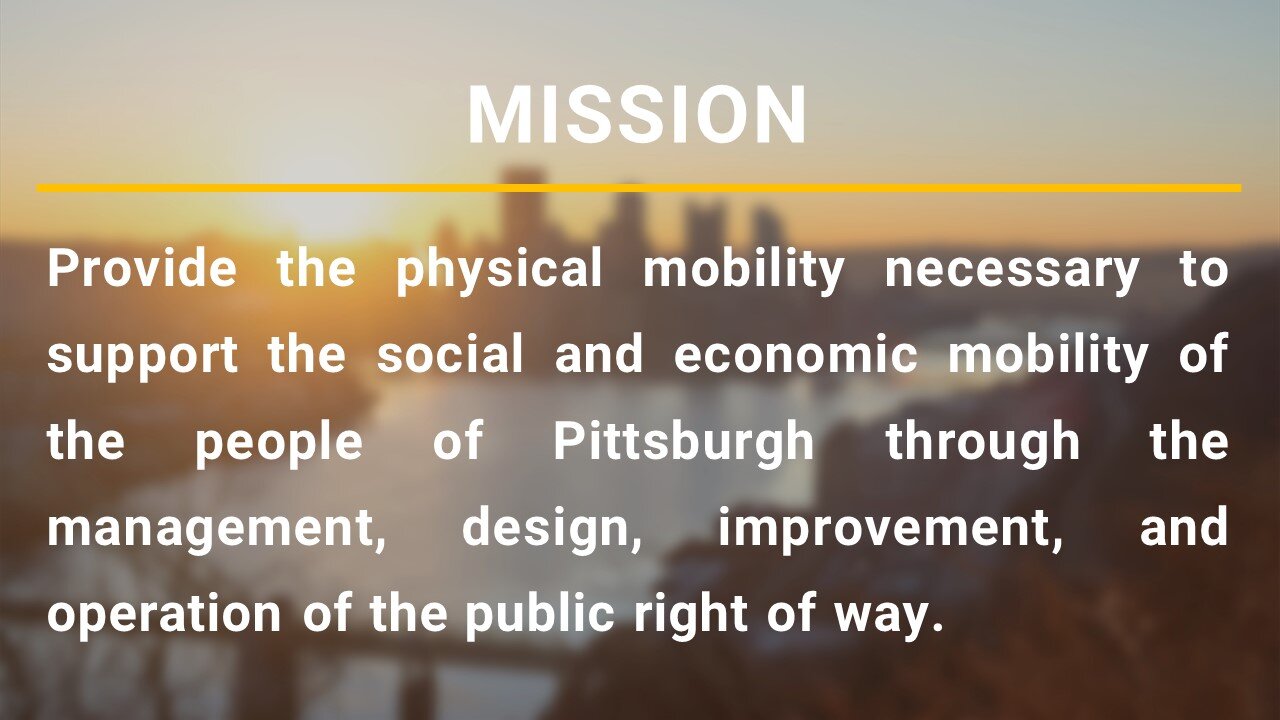
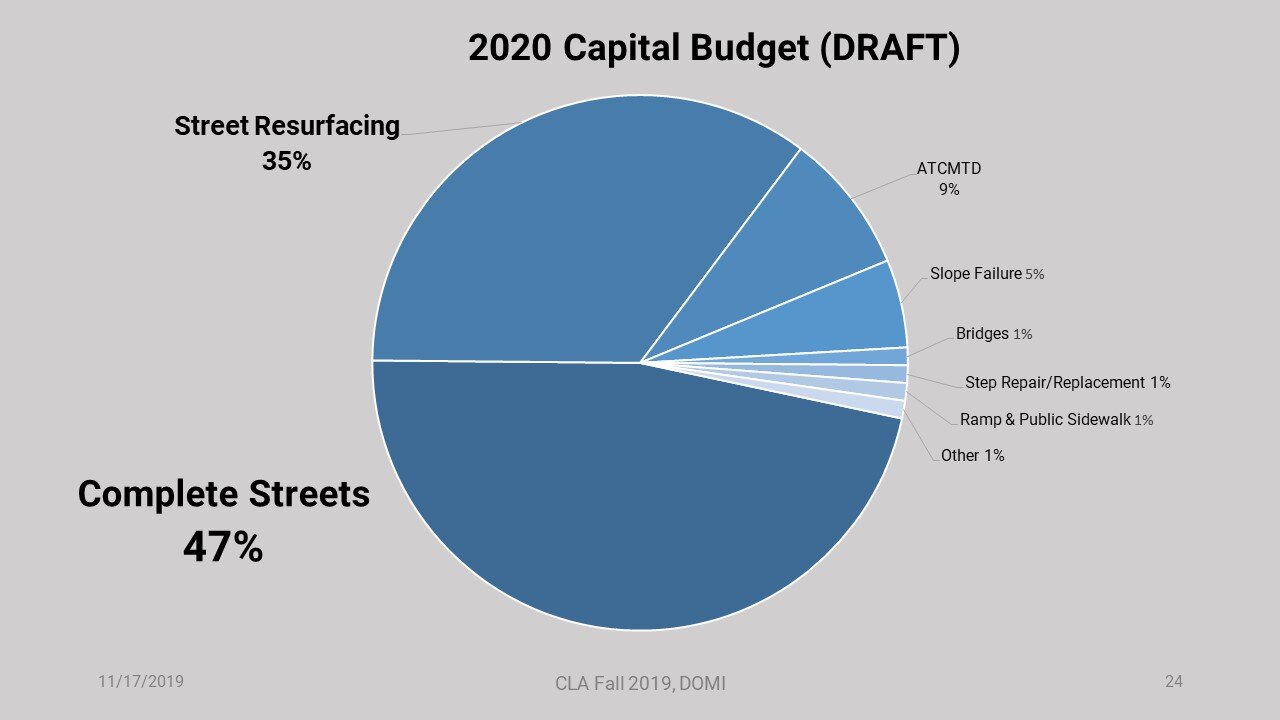
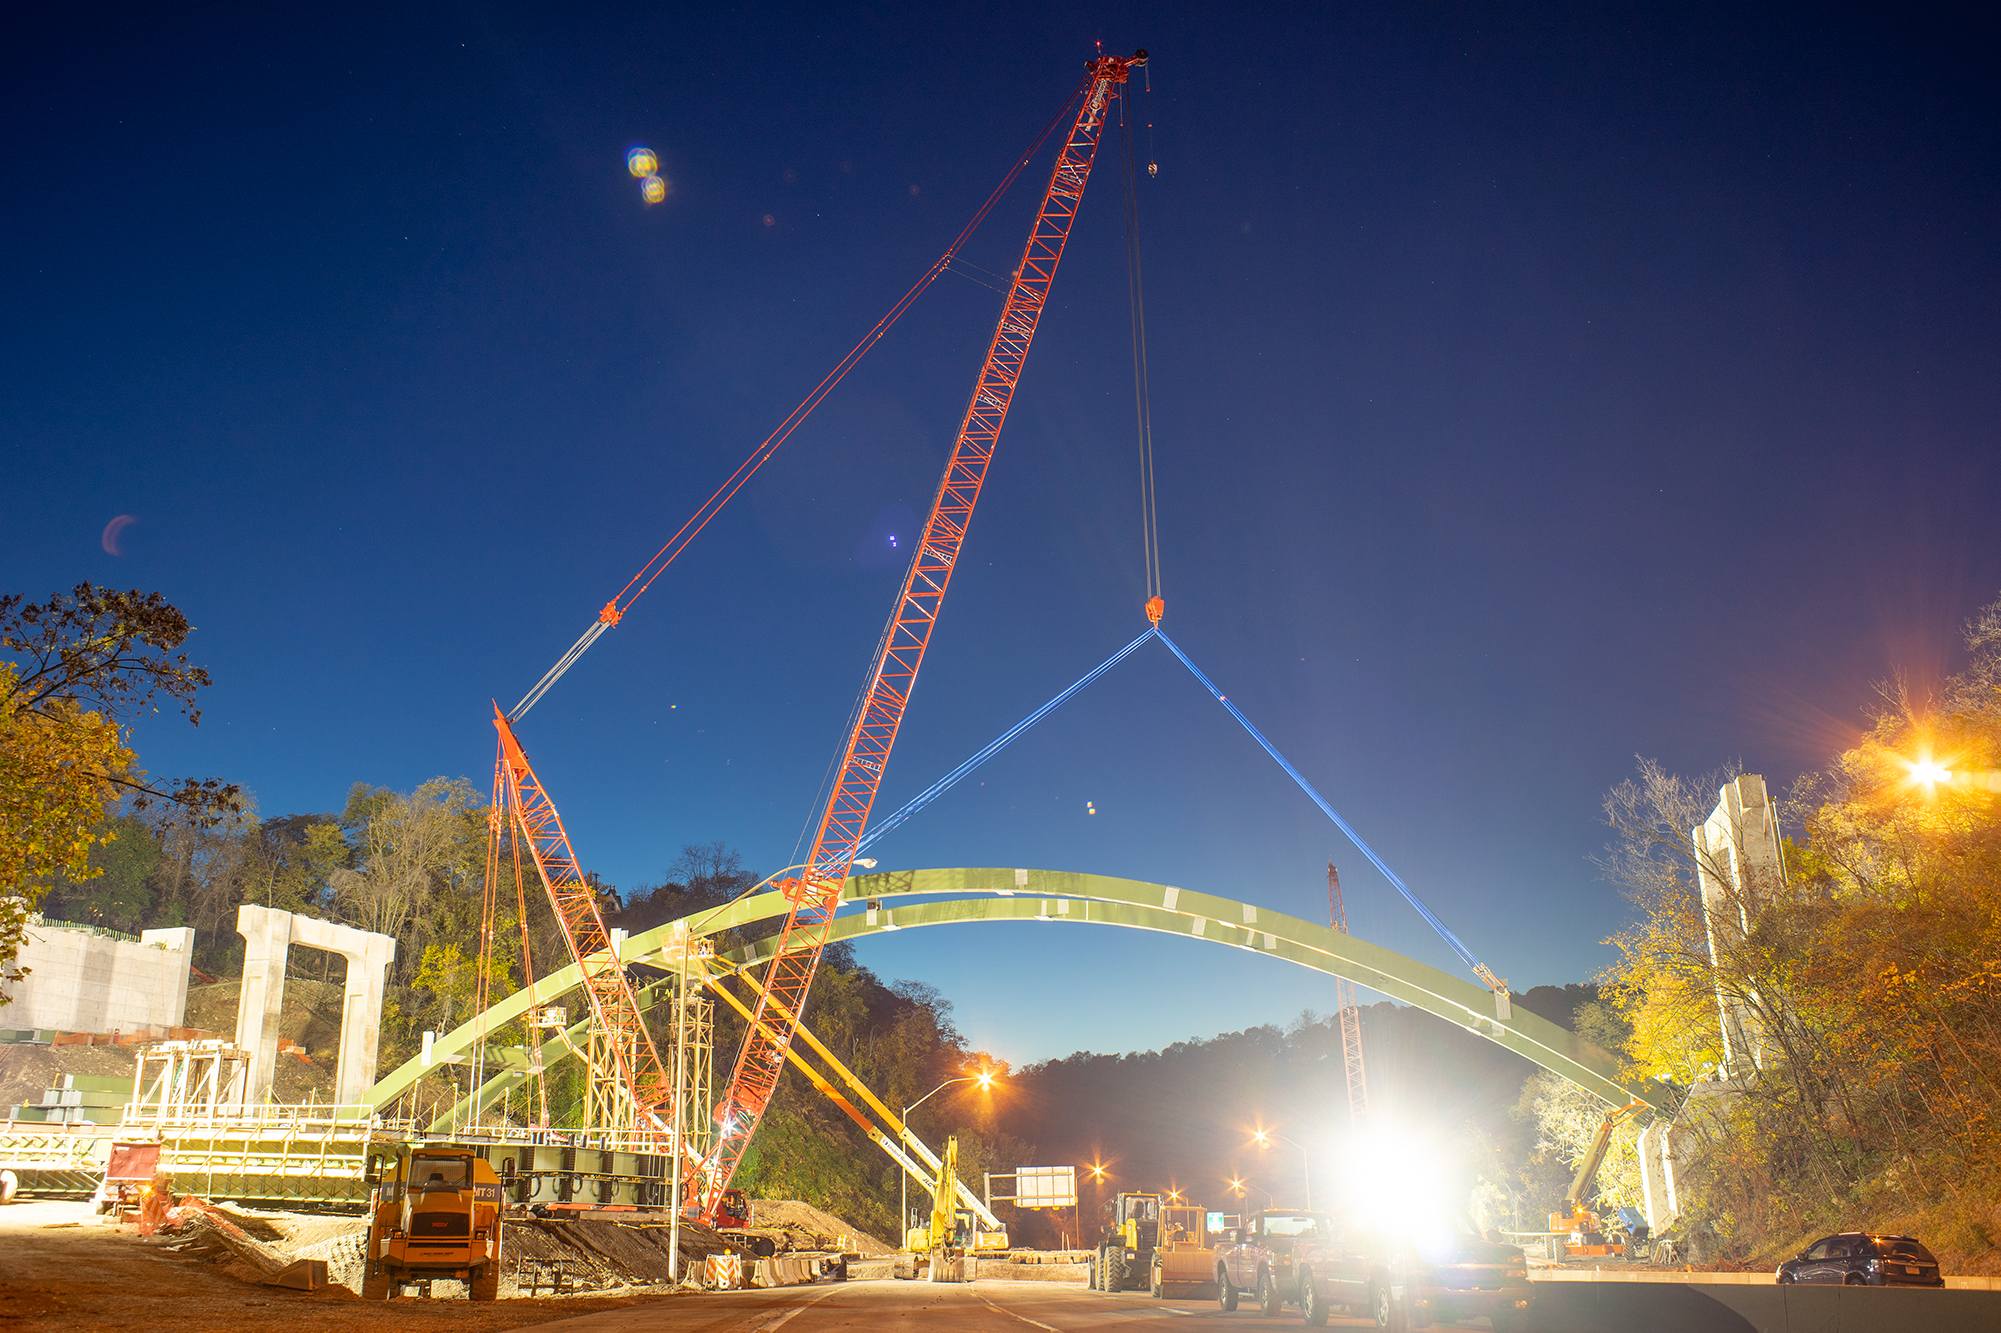
The presentation started with an overview of our department mission, goals, and structure. Following that I used local statistics to illustrate our infrastructure footprint and the transportation landscape in the City. Then tag teamed with my coworkers to cover specific examples of our work including long term bridge reconstruction, continual maintenance, new policies, emerging mobility, and more.
Content Creation
Graphic Design, Illustration, Photography, Video


